The Ocean Conservancy, together with the Commonwealth Scientific and Industrial Research Organisation, was supported by the NOAA Marine Debris Program and analyzed datasets from their 30-year International Coastal Cleanup efforts as well as five years’ worth of data from NOAA's Marine Debris Monitoring and Assessment Project. This project used a statistical model to identify geographic patterns and trends in marine debris distribution, assessed marine debris management actions, and produced recommendations to improve marine debris monitoring protocols.
Type of Project: Research
Region: National
Project Dates: September 2015 - December 2016
Who is involved?
The NOAA Marine Debris Program partnered with the Ocean Conservancy (OC) and scientists and statisticians from the Commonwealth Scientific and Industrial Research Organisation (CSIRO) (through a sub-contract from the OC) and conducted a rigorous analysis of the OC’s 30-year International Coastal Cleanup (ICC) dataset and the NOAA Marine Debris Program’s Marine Debris Monitoring and Assessment Project (MDMAP) dataset to detect trends and patterns of marine debris on U.S. shorelines.
What is the project and why is it important?
Marine debris is an ecological threat that can injure organisms that ingest or get entangled in it, damage habitats, cause navigational problems, and drive tourists (and their wallets) away from beaches. There are many efforts to address this issue, including the International Coastal Cleanup (ICC), the largest international annual cleanup effort that has been led by the Ocean Conservancy for the past 30 years. In addition, the NOAA Marine Debris Program has a shoreline monitoring program (the MDMAP), where a network of dedicated volunteers conducts monthly marine debris surveys at select sites across the United States. As a result of these efforts, both the Ocean Conservancy and NOAA possess large marine debris shoreline datasets, although neither had been rigorously analyzed.
This study analyzed the OC’s ICC dataset and NOAA’s MDMAP dataset, and conducted monitoring fieldwork in order to compare and contrast the OC cleanup protocols with NOAA and CSIRO marine debris shoreline monitoring protocols, identifying areas for improvement to strengthen each protocol. CSIRO researchers and statisticians analyzed the NOAA and OC datasets to develop a baseline estimate of the amounts, types, sources, and distribution of marine debris around the U.S. The NOAA and OC datasets were independently analyzed using a generalized additive model (GAM) to uncover unique insights from each dataset and identify important variables driving marine debris patterns.
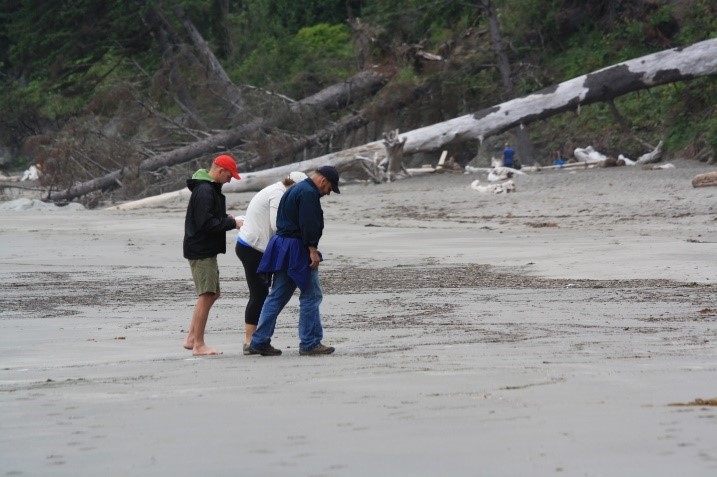
The protocols from NOAA and CSIRO (CSIRO protocols developed by Drs. Denise Hardesty and Chris Wilcox) were compared during a field monitoring effort in July 2016. Team members from CSIRO, OC, and NOAA conducted field monitoring surveys using both protocols on adjacent areas of the same beach. Due to logistical constraints, the OC protocol could not be compared to the NOAA and CSIRO protocols. However, recommendations to improve both the OC and NOAA protocol were provided for shoreline monitoring and cleanup efforts moving forward.
What were the project results?
Results from this project provided valuable insights into the state of marine debris on U.S. shorelines, uncovered interesting stories about management initiatives, and illustrated that important findings can be derived from citizen science data collection efforts.
It is estimated that at any given moment, between 20 million and 1.8 billion marine debris items can be found on the shoreline of the continental United States, given that debris is constantly being deposited onto and washed off the shoreline. Findings from OC’s dataset indicated high marine debris loads, or hotspots, on the shorelines of Texas, the Gulf States, California, and the Mid-Atlantic states. An in-depth analysis of the U.S. West Coast, where the majority of NOAA monitoring sites currently exist, indicated that when sampling bias and potential land-based sources of marine debris were controlled for by the model, higher debris loads were found north of Cape Mendocino, California. This corresponds to oceanographic conditions that result in deposition of debris in these areas. Analysis of NOAA’s data showed that container deposit legislation for plastic bottles in Hawaii, Oregon, and California was effective in reducing the amount of plastic bottles found on the shoreline of those states. A number of important drivers of marine debris loads were identified and warrant further investigation, including, but not limited to: distance to rivers, watershed characteristics, local socioeconomics, shoreline/beach access, and population density.
 An official website of the United States government.

