An official website of the United States government.
.")
Entering the Data
The final step to successfully participating in MDMAP is entering your data into the MDMAP database. Your class only needs one account to enter data, and data should only be entered once for each survey you complete (you will be able to enter data for each transect within one survey page). Data should be entered online into the MDMAP database after creating an account. This website also contains data visualization and exploration tools! For detailed instructions, visit the Monitoring Toolbox. If you have not already, it may be helpful to watch MDMAP Training Video 4: Categorizing Debris and Uploading Data before entering your data into the database. Discussion questions for all of the MDMAP training videos are also available.
How to Prepare Your Data
Back in the classroom, have students organize their data sheets by tallying the final count of each item they collected. You can work together as a class to enter the data for each transect, using the final tally of each item from each student’s datasheet. After the Survey Coversheet information is entered, each transect group will begin by “adding a new transect” and filling out the online form with what they have on their transect sheet. The questions and data entered should match what’s on their transect sheet. Continue adding a “new transect” until all transect sheets have been entered. Double check for any data errors and then hit submit. If you missed any part of the form, you will be alerted of the error in red and unable to submit until the error is fixed.
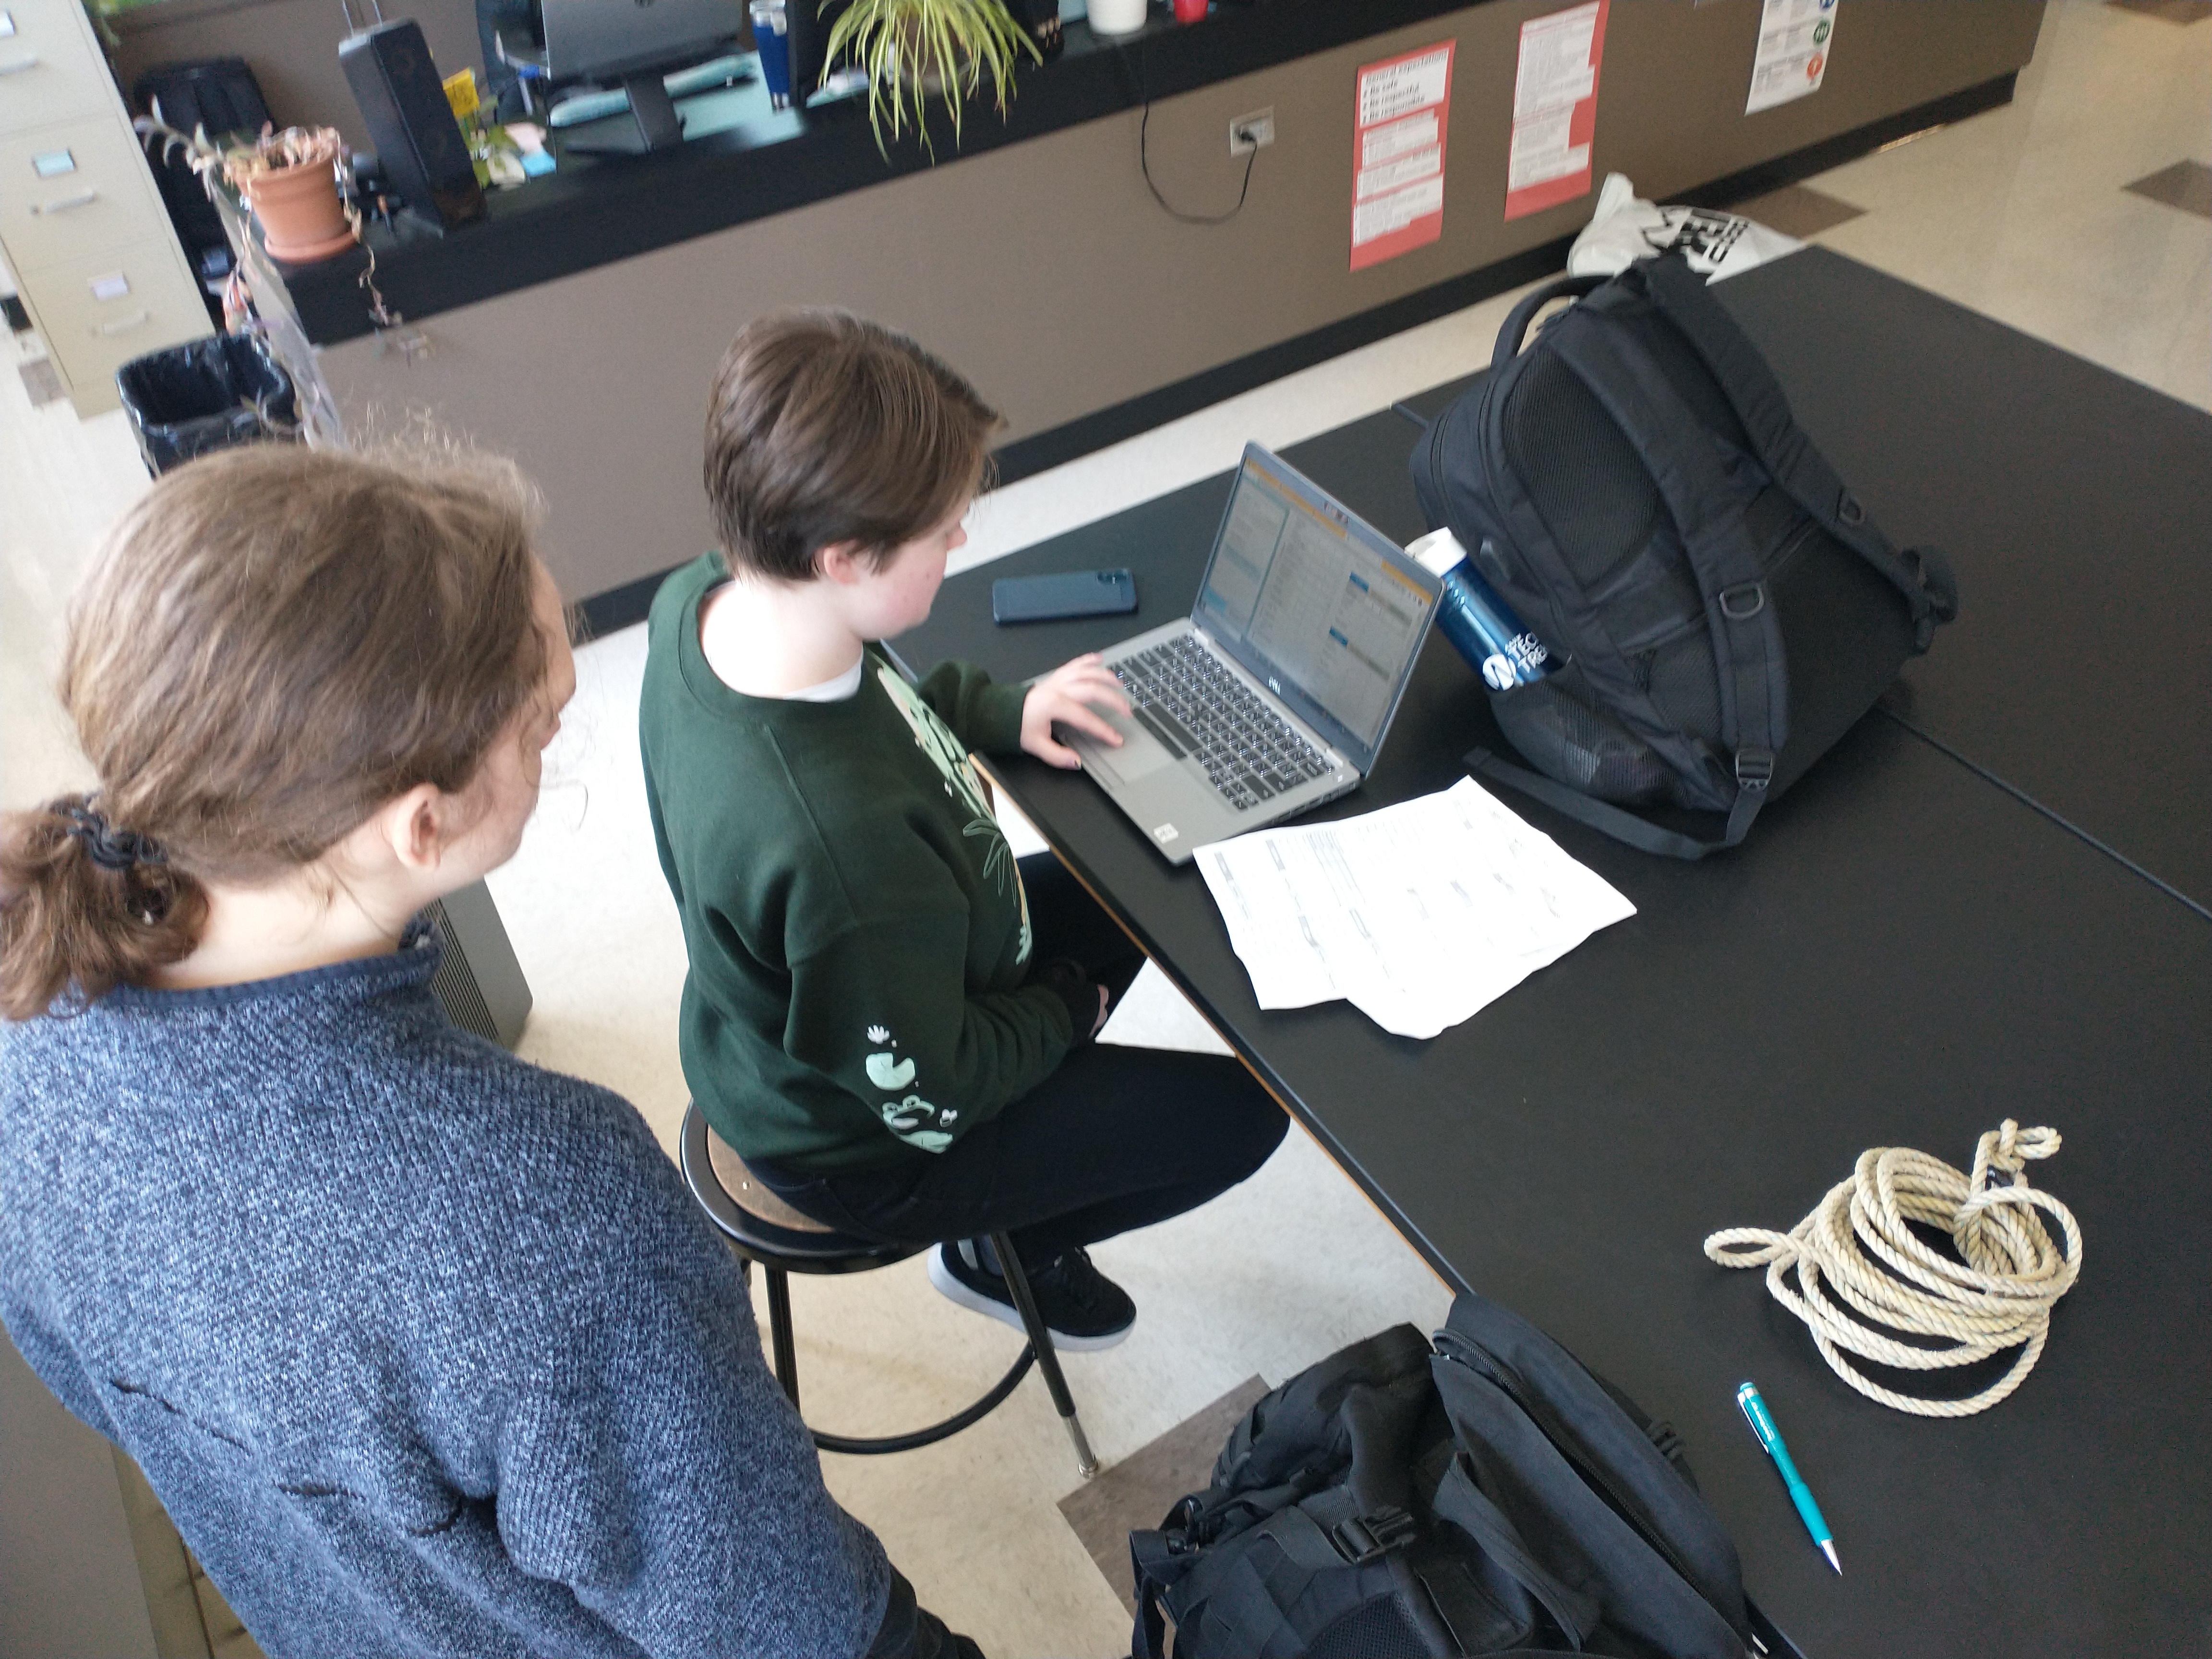
Teacher Tip: Alternatively, you may want to create a rotation of stations for students to work through, with one station for data entry. An educator or student leader could log in with the class account and guide the group through entering data from the Survey Coversheet, then each student group could use the same computer and account to enter the data from their transect. Additional stations could include:
|
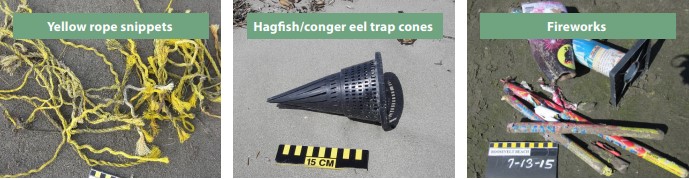
Is there an additional item not found in the database that you think should be monitored in your area? Participants can use custom items that were created by others using a drop-down menu during data entry or, if necessary, request creation of a new custom item by contacting md.monitoring@noaa.gov. To add a custom item to track at your site, list it on the datasheet in the “Custom” section. Once a custom item has been added to a survey transect during data entry, it will appear by default in the database debris list for all future transects at that site.
After data are entered into the MDMAP database, they are reviewed by a NOAA Marine Debris Program staff member. During this review, we check to make sure that data were collected following the MDMAP protocol, and look for any issues with debris categorization, feedback provided, etc. During this process, NOAA Marine Debris Program staff may reach out to survey team members for clarification, as needed. Once any issues are resolved, data will be marked as “verified” and published for public access. Unverified data can only be viewed by site participants and administrators.
Using the Data
The data you collect through MDMAP surveys can benefit scientists and policymakers, but it can also be an excellent tool for your curriculum. There are many ways you can incorporate data analysis, visualization, and use in your classroom. You are the expert on your students, standards, and curriculum, but we have a few suggested activities that are appropriate for students of various ages.
Data Analysis
By reviewing the survey data, students can identify and answer questions about debris accumulation in your area. Depending on what kinds of debris you find, or the area in which you’re working, you may prompt them with some of the following questions.
Discussion Starters - Data Analysis
- What type/item of debris did we find the most? Why might that be?
- Where do we think these items came from? Are there any items that we could find in the classroom, or in our homes?
- What impacts will this debris have on the environment?
- Which items/types of debris will have the greatest impact and why?
- What species, habitats, or communities could experience the greatest impacts from the types/items of debris you found?
- Can we think of any ways to prevent this item from becoming debris in the future?
- Are there any policies or practices in place in our community that should have prevented this item from becoming debris?
- What could be some potential causes of these changes?
- Can we make any predictions about future surveys based on these trends? Why or why not?
- Were you able to answer any of the questions you asked while planning using your data? If not, why not?
- Do you have any new questions to add or change based on the data you collected?
Your data isn’t limited to one school subject, either! Bring your analysis into math by having students use the data to ask and answer word problems centered around topics or standards you are working on. Older students can also calculate standard deviation and conduct other statistical analyses. Practice Language Arts skills by writing informational or persuasive articles for school or local publications about the issue of marine debris, using your survey data as evidence to support their claims. Students can also write creative stories about a piece of debris and its journey to your survey site, or about the experience of a marine creature or beachgoer that encounters that piece of debris in their environment.
Visualizations
Whether your students are learning about bar, line, or pie charts, you can use your debris data to practice their skills. Some students may be practicing creating hand-drawn charts, while other students can download their data into an Excel or other spreadsheet.
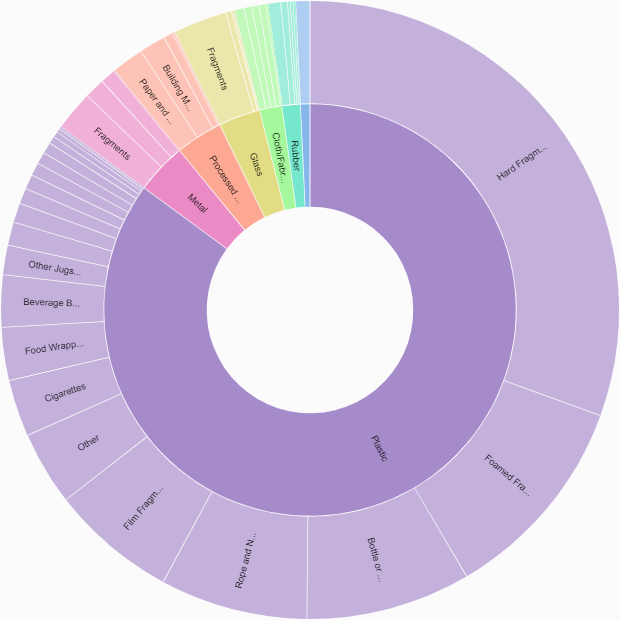
The MDMAP database automatically creates donut diagrams to represent data. These are dynamic, modified pie charts that can break down multiple levels of data according to material type and item. Have students create their own debris breakdown based on the materials found in your survey!
Students may be interested in taking their data visualizations beyond charts and graphs. To follow up on your initial practice, you can assign students with creating marine debris data infographics. These posters can help raise awareness about debris issues in your area, while practicing science communication and creative skills.
Taking Action
Now that you’ve collected and analyzed data about the marine debris issue in your area, it’s time to use that data to make a difference.
The student-centered pedagogy behind project-based learning is a perfect complement to solutions-oriented education about marine debris. After completing surveys to answer questions about concentrations and types of debris in their area, students can easily identify and connect the issue to their own habits and communities. Providing authentic, disciplinary, collaborative, and iterative project opportunities in the classroom will deepen students’ engagement with the material and help them create lasting change in our environment.
Discussion Starters - Project Brainstorming
- Were there any debris items or types that you found more than others? What impacts could that debris have on the environment or humans in your community?
- Where could this debris be coming from? Why could it have ended up in your survey site?
- What are possible solutions to these debris problems? What are the barriers to those solutions?
- Who are the key audiences for implementing these solutions? Who do we need to share our ideas with?
- What is the best method for these solutions? Raising awareness? Engineering? Policy? Something else?
There’s no limit to the kinds of projects that MDMAP surveys can inspire. Here are a few examples:
- A community with high amounts of plastic bag debris might work with local grocers on a “Bring Your Bag” campaign, providing prizes or discounts to shoppers who bring reusable bags to the store.
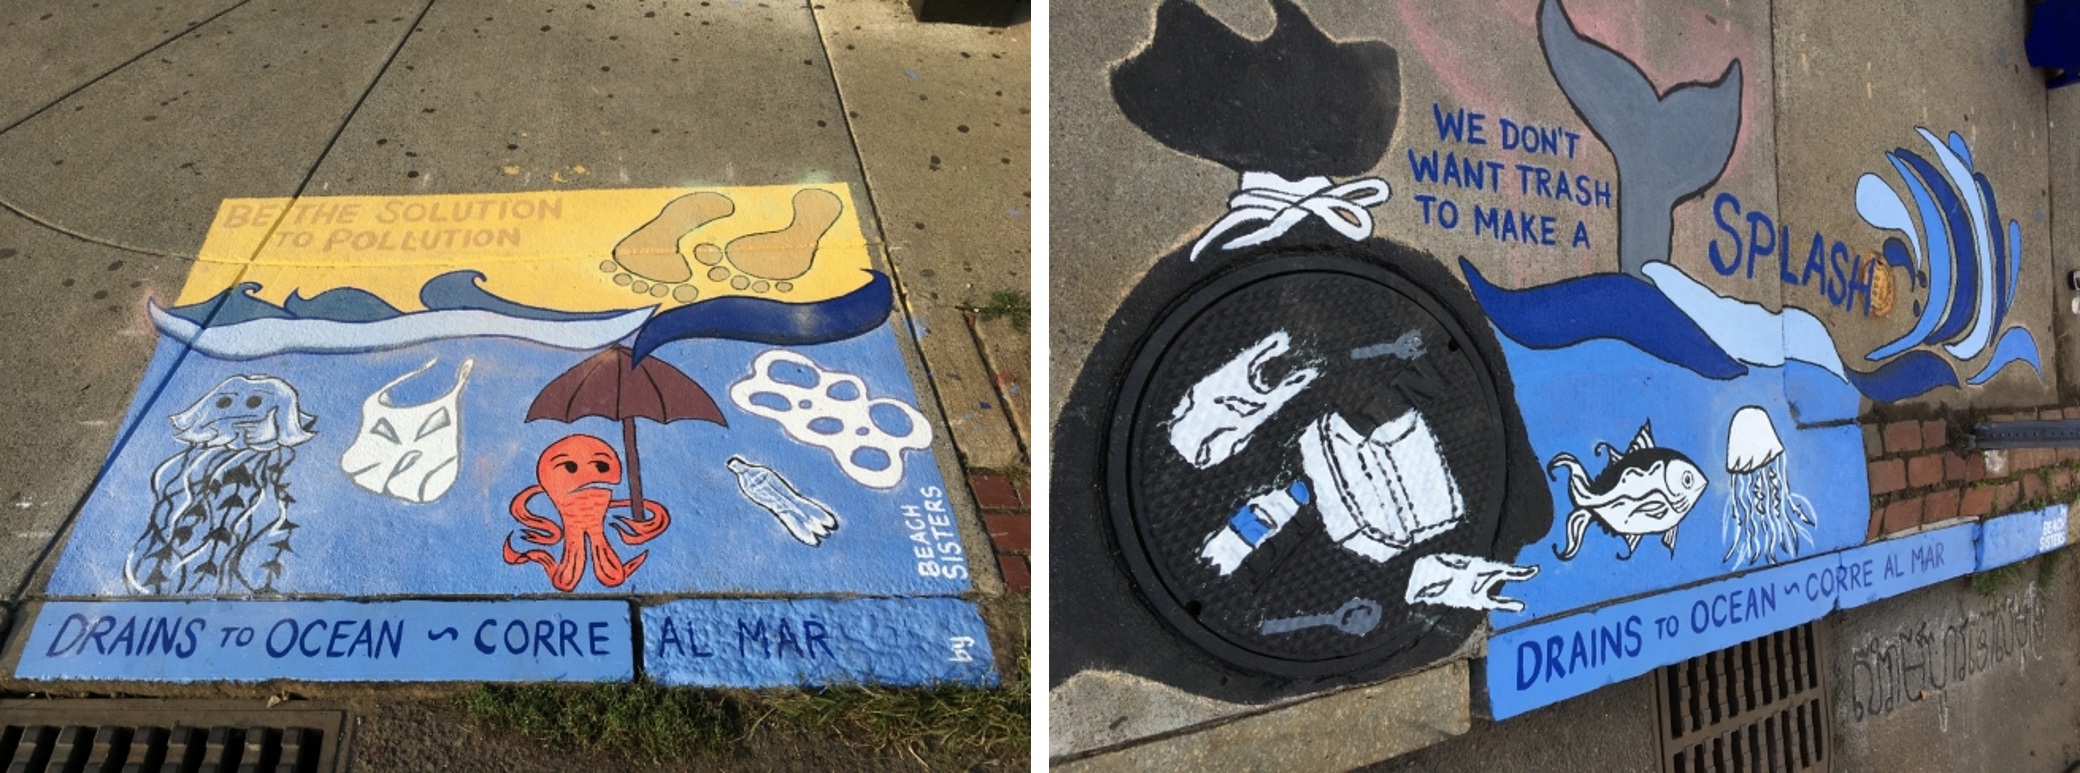
- A community with significant stormwater debris might work on an engineering challenge to create a trash trap that keeps debris from entering larger waterways.
- A student group who is passionate about digital media or film-making could use their data in a public service announcement campaign, filming their own videos and sharing them on social media to inspire behavior change.
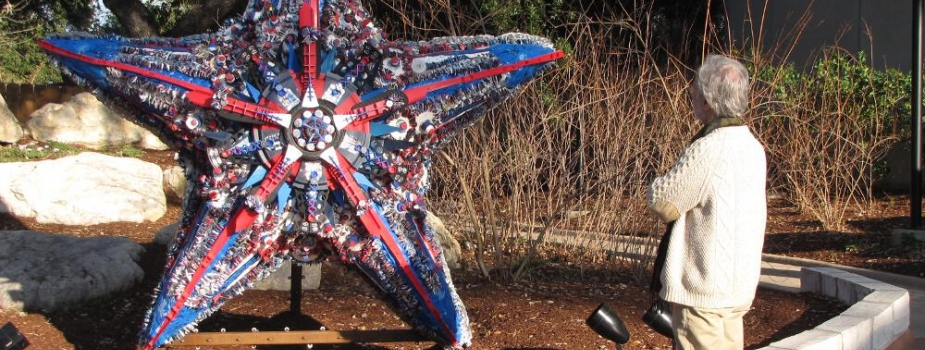
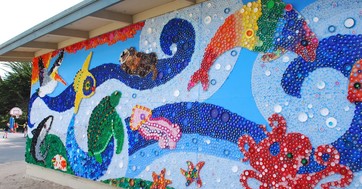
- Artistic student groups can use repurposed marine debris or other materials to create an engaging and informative display sculpture aimed at solving a problem related to marine debris in the community.
The most effective project-based learning units will provide students with an opportunity to combine 21st-century problem-solving and critical thinking skills with disciplinary content they have learned about the issue to make an impact on the environment. We’ve suggested a few potential curricular approaches and projects below, but the best kind of project-based learning experience is the one that resonates with your students’ lives. Letting the student-driven data analysis drive project design and implementation increases engagement and makes for more effective efforts!
Capacity-Building Support and Resources for Project-Based Learning Units
The NOAA Marine Debris Program supports projects across the country that use outreach and education as a way to prevent marine debris. These projects aim to change behavior, especially among youth, and provide them with hands-on experiences that deepen their understanding of the marine debris problem. The NOAA Marine Debris Program maintains a library of helpful resources and references available for educators to use for free. We have compiled a few of those resources below for inspiration and reference in creating authentic, meaningful student projects after conducting MDMAP surveys.